

In some cases, we approach the data with a certain relationship in mind. One may think of a human brain acts as a machine learning algorithm searching for patterns. Yet, these patterns may be biased by our own willingness to find certain relationships in the data, which fit our ideas. One of such examples subject to debate is the relationship between economic inequality and adoption of digital currencies, novel to the literature: Is the propensity to mine and use bitcoins higher in egalitarian societies? Or, perhaps, unequal societies tend to adopt bitcoins more? The first hypotheses would imply a negative relationship between bitcoin adoption and inequality, whereas the second – a positive relationship. This blog post lets the data speak for itself. Let us explore the data and make some educated guesses!
Could there be a link between inequality and bitcoin adoption at all? Bitcoin is based on the proof-of-work concept (Nakamoto, 2008), whereas other digital currencies like Peercoin, Blackcoin, Nxt, Cardano, and Algorand are using the proof-of-stake concept (Saleh, 2021). In addition, it was announced that Etherium (another major DC) will become a proof-of-stake DC in the course of 2021. In terms of inequality semantics, receiving bitcoins as a remuneration for sophisticated calculations involving graphical processing units (also known as mining) as a proof-of-work is a rather egalitarian framework, comparing to receiving DCs as a form of transaction fees for holding and validating these. Thus one could assume that egalitarian societies, countries with lower inequality, would be favoring bitcoin adoption.
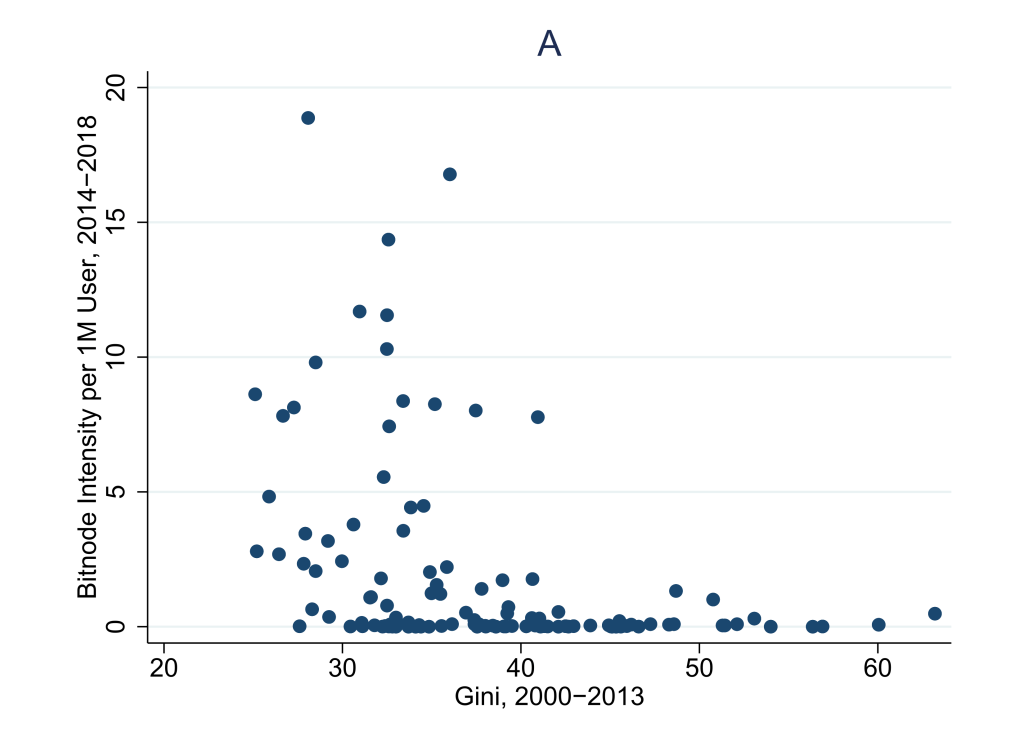
What would we see if we plot an indicator for bitcoin adoption against an index of inequality, for example the Gini index? The data from Saiedi, Broström and Ruiz (2021) and the World Bank are matched together on the figure above. At a first glance, there is an inverse relationship between the Gini coefficient of the disposable income, measured before the bitnode intensity per 1 million users, yet, this pattern may be misleading due to other features of the data, hidden from the eye: A vast share of countries has a bitnode intensity close to zero, whereas other countries do exhibit a single clear pattern and are rather scattered in groups.
We can apply unsupervised machine learning to check whether our guess about the complex composition of the data is right. A simple clustering model, such as a Gaussian Mixture Model as in Hastie, Tibshirani and Friedman (2017, p. 463), can help us out with this task. After clustering, the division of countries in groups becomes more intuitive: class one includes countries with bitnode intensity close to zero, whereas class two incorporates countries with moderate bitnode intensity. Both groups of countries have a wide range of Gini coefficient values from very low ones indicating rather egalitarian societies, to rather extreme cases. The third group of countries (like Germany, Ireland, the Netherlands, Lithuania, Luxembourg, Sweden and Switzerland) share a distinctive feature: They exhibit very high bitnode intensity along with relatively low Gini coefficients.
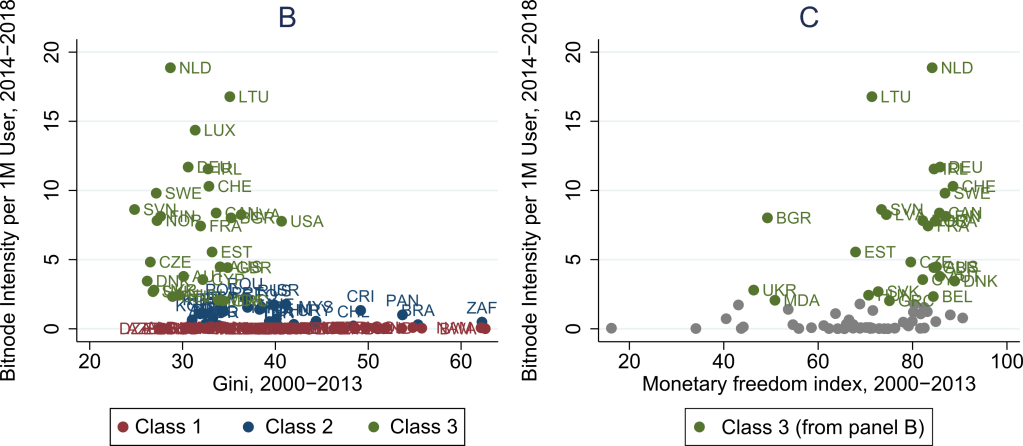
Which features do the bitcoin champions (class 3 on panel B) share? Let us make an educated guess. Although these countries indeed have a lower level of income inequality, they share dozens of other common features, which are more likely to contribute to bitcoin adoption than the distribution of income itself. Here institutional aspects come into play: Saiedi, Broström and Ruiz (2021) note the significant negative impact of regulatory restrictions against bitcoin adoption. From panel B one can see that the third class of countries enjoys high levels of monetary freedom as measured by the Heritage foundation. Countries in the third class share low inflation, which implies monetary stability, and virtually no price controls and, thus, demonstrate high economic freedom. These countries, with an exception to Ukraine, Moldova and Bulgaria, also have the highest bitnode intensity.
It follows that the link between inequality and bitcoin adoption is not as straightforward, as one may assume and the list of potential determinants of bitcoin and DC adoption should rather be expanded in the direction of institutions. The reverse causality link and the redistributive effect of bitcoin and DC adoption – another potentially interesting topic – are too early to assess, but this question could be revisited once sufficient amount of data on DC mining and usage from income surveys will be collected.
References
Hastie, T., Tibshirani, R. and Friedman, J. (2017). The Elements of Statistical Learning: Data Mining, Inference, and Prediction.
Heritage Foundation (2021). Economic Freedom Index. Retrieved on 07.06.21.
Nakamoto, S. (2008). Bitcoin: a peer-to-peer electronic cash system.
Saiedi, E., Broström, A. & Ruiz, F. (2021). Global drivers of cryptocurrency infrastructure adoption. Small Business Economics, 57, 353–406.
Saleh, F. (2021). Blockchain without Waste: Proof-of-Stake. The Review of Financial Studies. 34 (3): 1156-1190.
World Bank (2021). World Bank Development Indicators. Retrieved on 07.06.21.
Vadim Kufenko, scientific staff member of the chair of Monetary and International Macroeconomics of the University of Hohenheim
